Lightning strikes
Track thunderstorm activity over Croatia and Europe in real time.
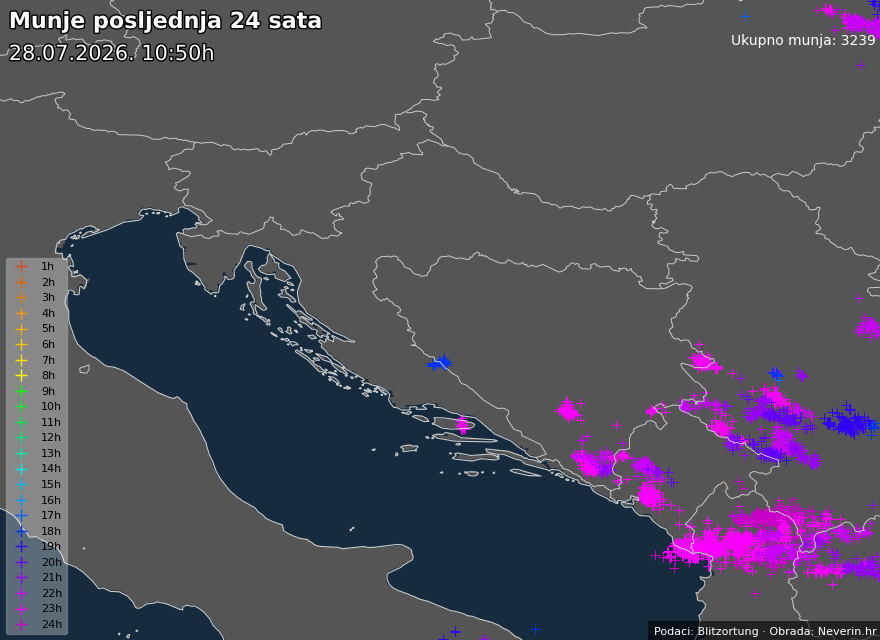
Static maps are shown. View the detailed interactive map that updates every minute.Lightning Croatia
Lightning Central Europe
Lightning Europe
Frequently asked questions
How often are the lightning maps updated?
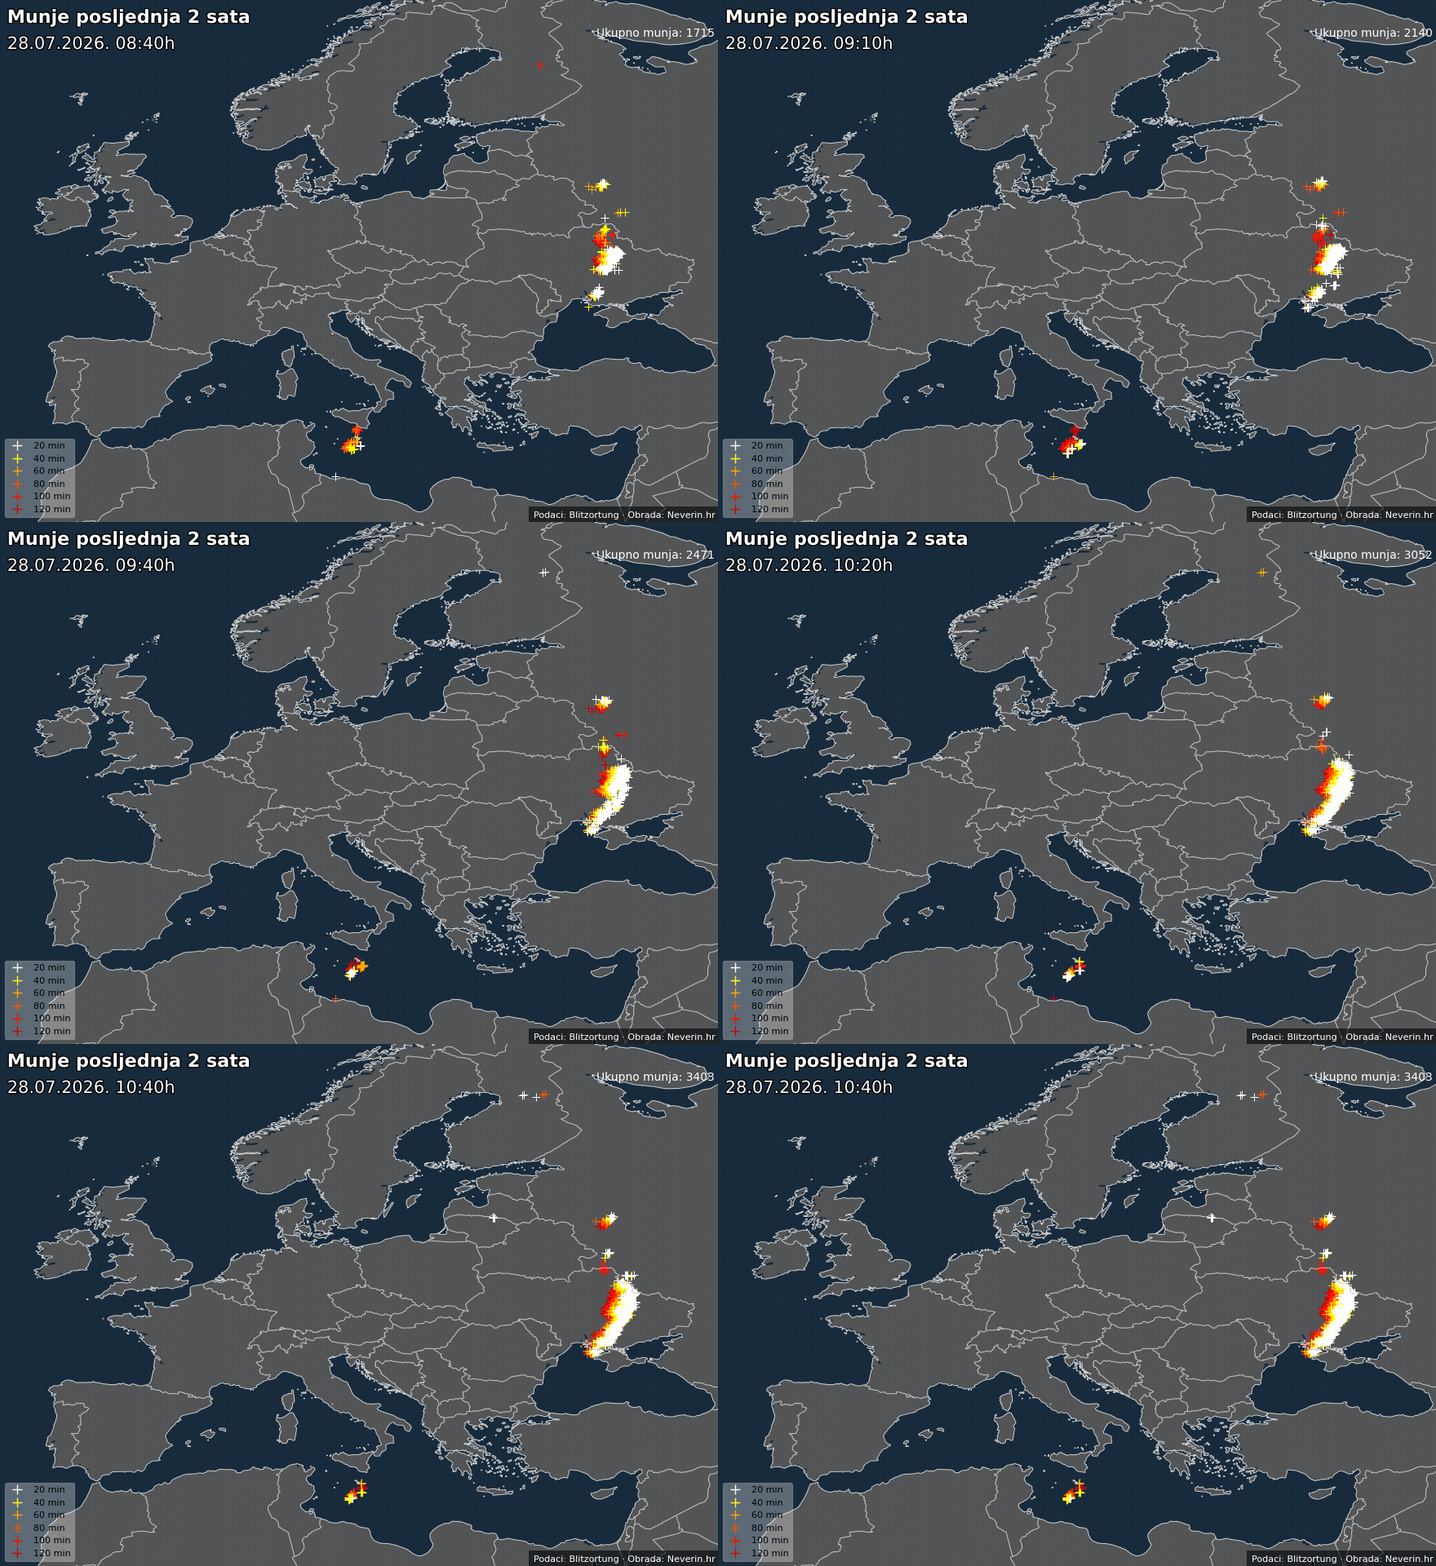
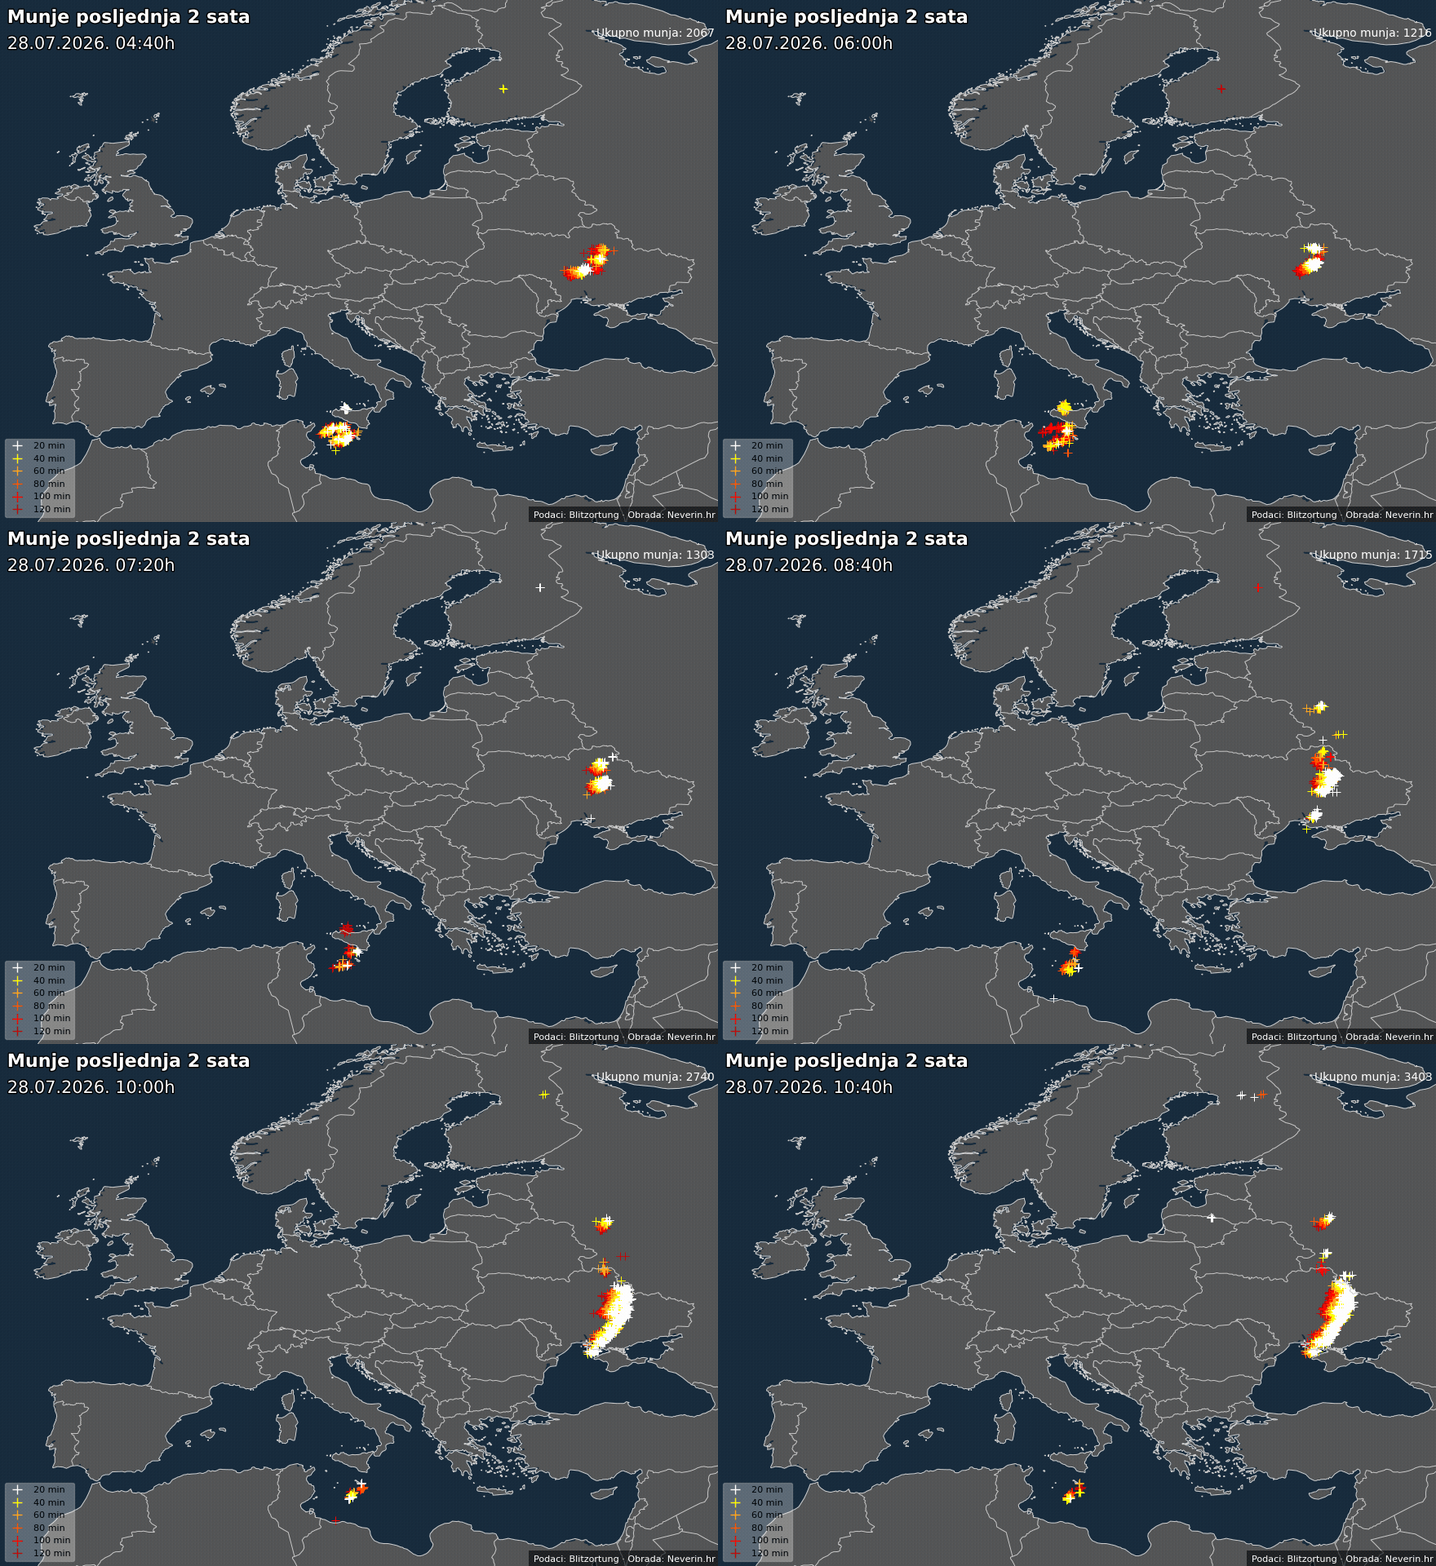
Static lightning maps are refreshed every 10 minutes. The interactive map on the Neverin homepage displays lightning strikes with a one-minute refresh, which is as close to real-time as it gets.
What do the colors on the lightning map mean?
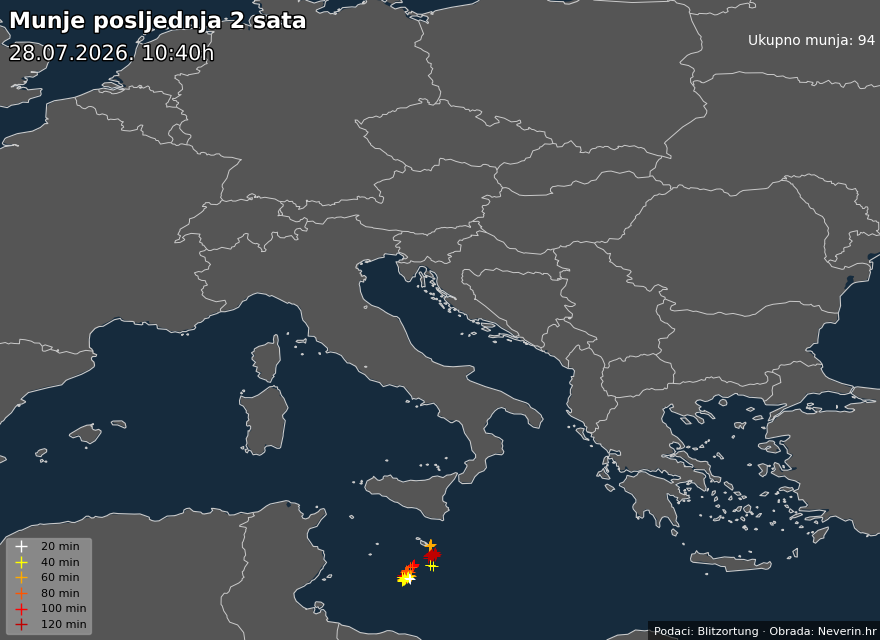
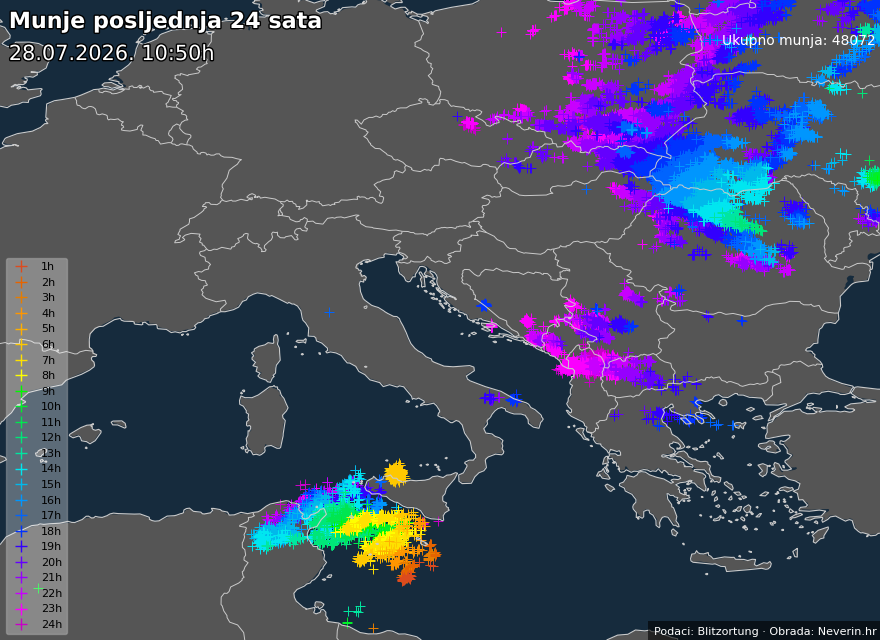
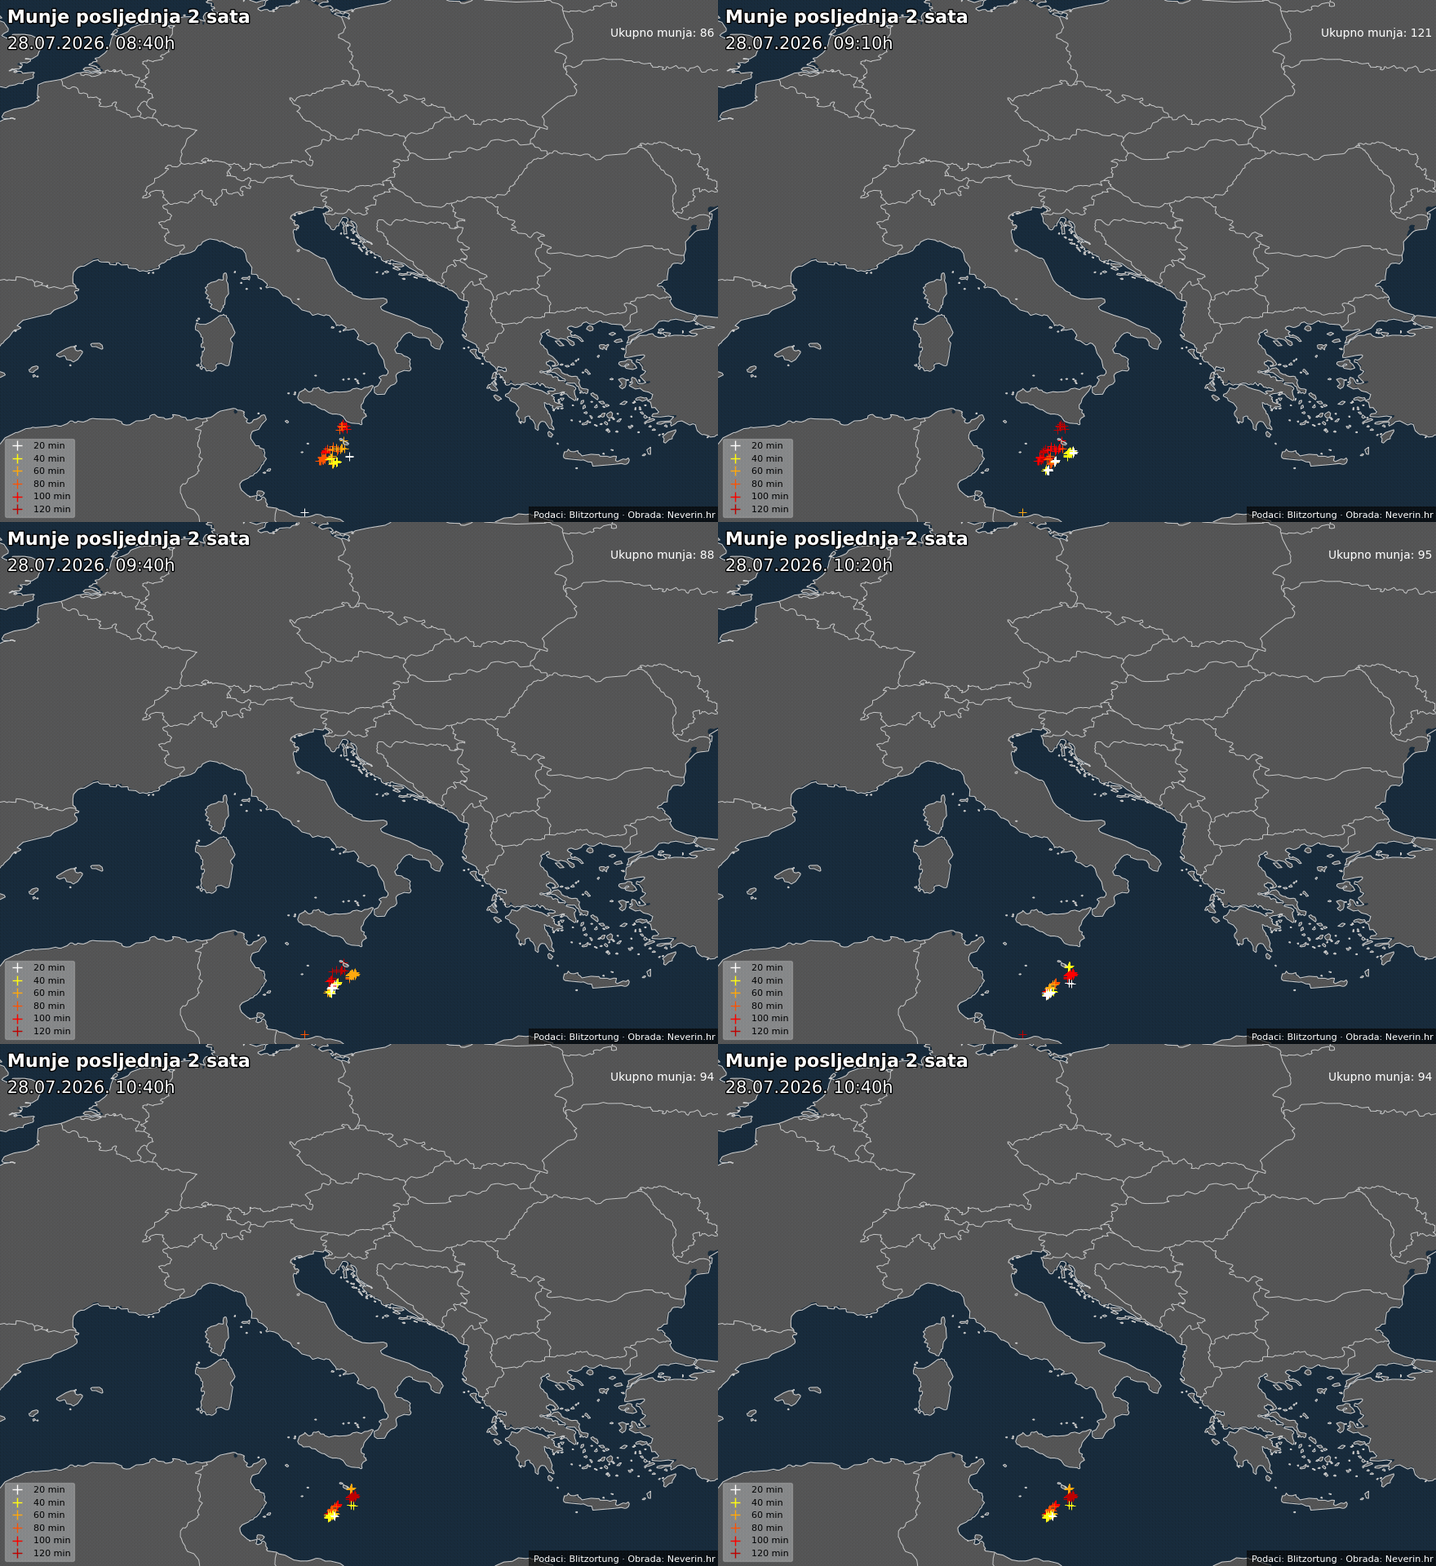
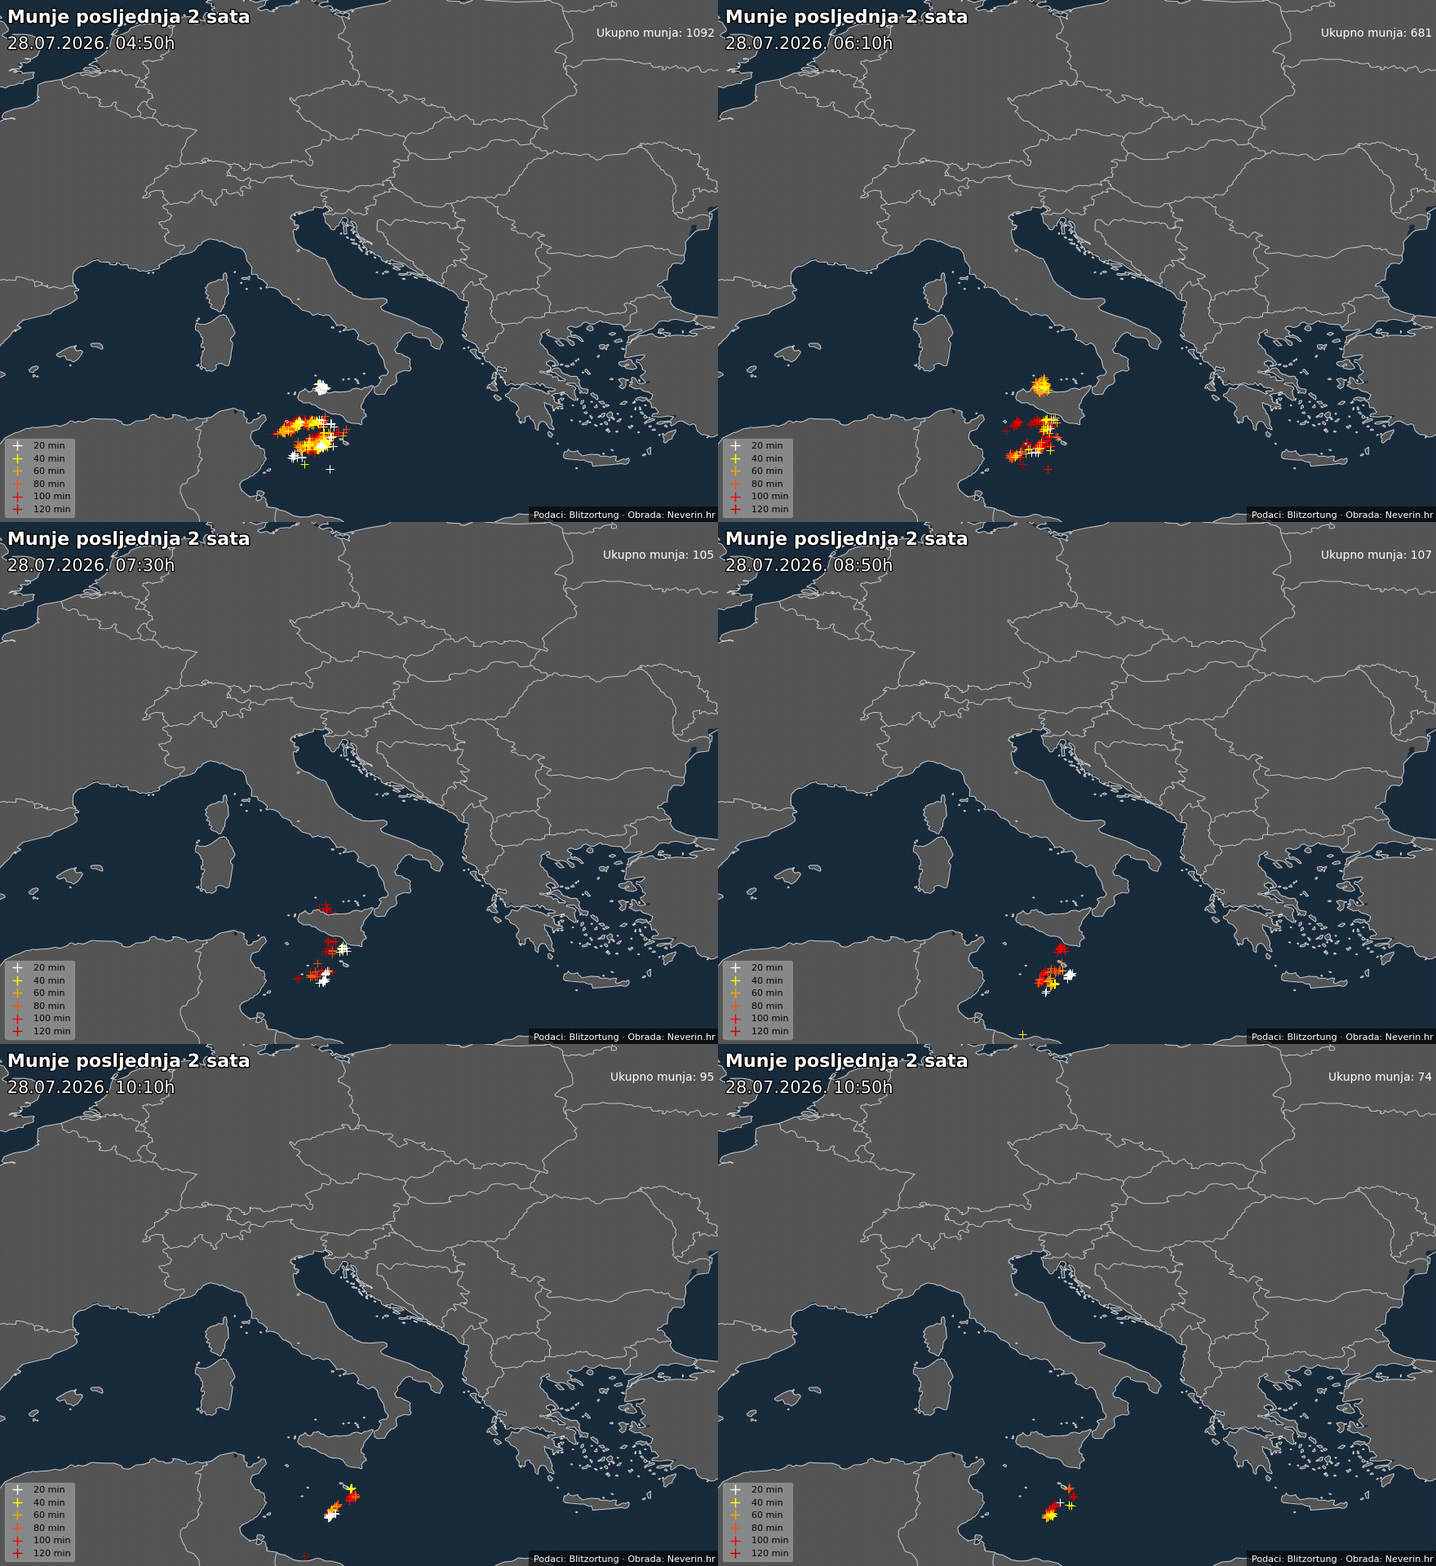
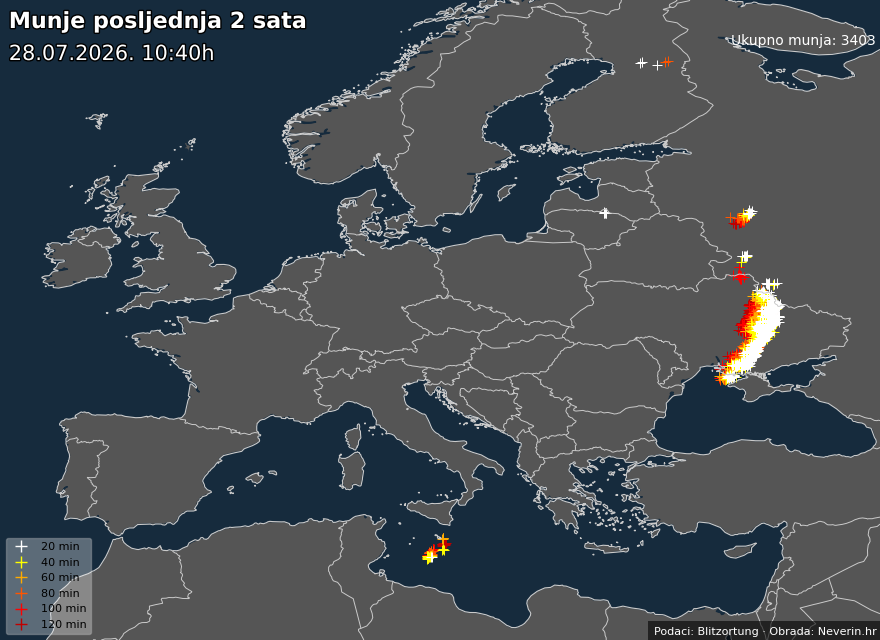
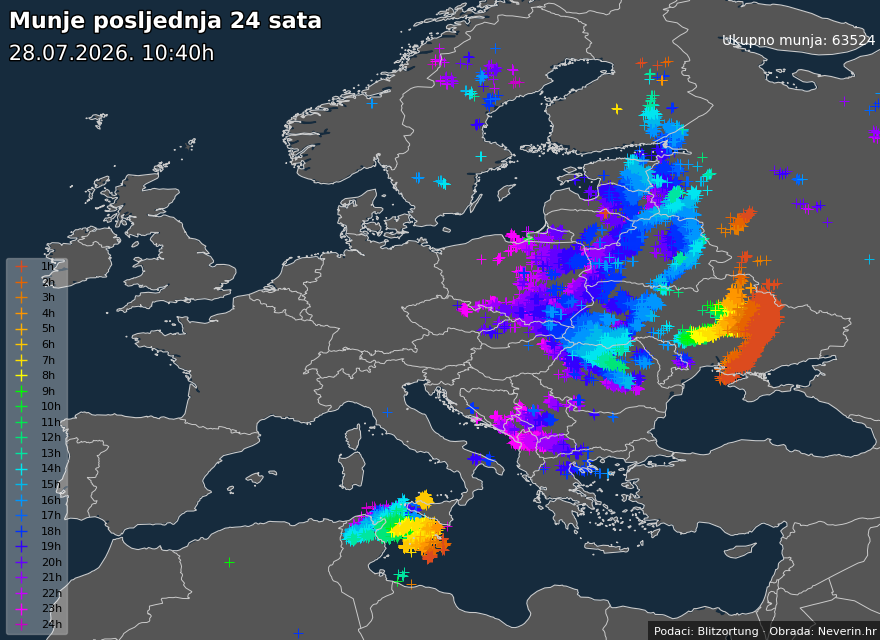
The color indicates the age of the lightning strike. White marks strikes recorded just now, while dark red marks those up to 2 hours old. This makes it immediately clear where a storm is currently most active and in which direction it is moving.
What is the difference between the 2h and 24h views?
The “Last 2h” view shows current thunderstorm activity in real time and is useful for tracking ongoing storms. The “Last 24h” view gives an overview of the whole day, where storm cells have passed and which areas saw the most atmospheric discharges.
How is lightning detected and where does the data come from?
Lightning is detected by ground-based receivers that record low-frequency radio impulses generated by each lightning strike. The exact location is determined using the time of arrival (TOA) method at multiple GPS-synchronized receivers, and the intersection of hyperbolas of equal time differences gives the strike location. Neverin is part of the Blitzortung.org network, which includes around 1800 active receivers worldwide, and is also an operator contributing to the network through its own sensors in Europe.
How accurate is the lightning data?
In areas with a dense network of receivers, the typical location accuracy is in the range of several hundred meters to a few kilometers. The further a strike is from the network or the more unfavorable the station distribution, the error grows and can reach several kilometers. In remote or mountainous areas with a sparser network, accuracy is lower, and weaker discharges, especially those within clouds, may go undetected. The network is therefore primarily reliable for tracking the development and movement of thunderstorm cells, while individual positions should not be taken literally at the street or building level.
The data shown is for informational purposes. Although the data is collected from the reliable Blitzortung network, brief deviations may occasionally occur due to receiver distribution or signal processing.