Weather maps
Interactive view of weather models for Croatia and Europe.
Current status of weather models
| Model | Run | Next update |
|---|
Frequently asked questions
What is a forecast (numerical) model?
Why do forecasts from different models differ from one another?
How far ahead do the forecasts reach and how reliable are they?
How often are the models updated?
Where does the data come from?
What the parameters mean
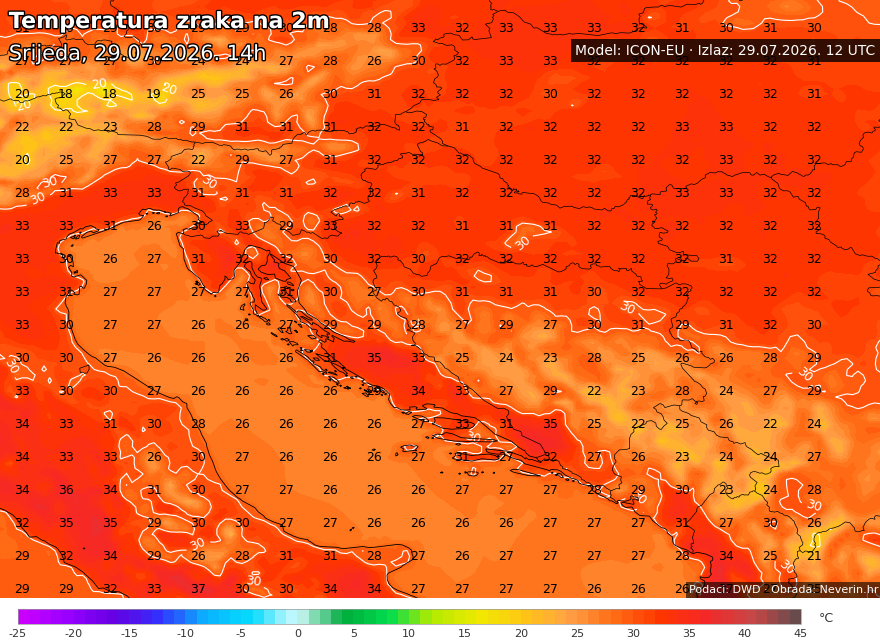
Temperature
Air temperature at 2 metres above ground, the standard measurement height. It shows how warm or cold it will feel at the usual level where we spend our time.
Relative humidity
The amount of water vapour in the air, expressed as a percentage, at 2 metres above ground.
Clouds
The estimated cloud cover of the sky. It helps predict whether the day will be clear, variable or overcast.
Sea level pressure
Atmospheric pressure reduced to sea level. High-pressure areas usually bring stable, clear weather, while low pressure signals changeable, rainy conditions.
Pressure and geopotencial
The distribution of pressure and geopotential height at the 500 hPa level (about 5.5 km up). It reveals the position of troughs and ridges in the upper atmosphere and thus shows how weather systems move across Europe.
Wind 10 m
Wind speed and direction at 10 metres, the standard height for measuring surface wind. Useful for gauging the strength of the bura, jugo and other winds.
Wind gust 10 m
The strongest short-lived wind gusts at 10 metres. They matter because gusts can be much stronger than the average wind speed and more often cause damage.
Temperature 850 hPa
Temperature at the 850 hPa level, which corresponds to about 1.5 km altitude. As it is not affected by local surface heating or cooling, it is used to identify warm and cold air masses and the arrival of fronts.
Precipitation last 3h
The amount of precipitation (rain, sleet or snow) that falls over a 3-hour period. It clearly shows the intensity and timing of precipitation through the day.
Accumulated precipitation
The total accumulated precipitation from the start of the model run to the selected time step. It gives an overview of how much will fall in total over the whole forecast period.
Type of precipitation
Shows whether the expected precipitation will fall as rain or snow. It is especially useful in winter, when the line between rain and snow is decisive.
Snow last 3h
The amount of fresh snow that falls over a 3-hour period. This value does not show how much snow will settle on the ground, but how much precipitation is expected to fall as snow.
Accumulated snow
The total accumulated snowfall from the start of the model run to the selected time step.
Snow depth
The estimated depth of the snow cover on the ground. Useful for forecasting how much of the fallen snow will remain on the ground or melt.
CAPE and Lifted index
Indicators of atmospheric instability and the potential for thunderstorm development. Higher CAPE values and a more negative Lifted Index point to a greater chance of heavy showers, thunderstorms and severe weather.
Temperature anomaly 2m
The difference between the forecast 2 m air temperature and the long-term average for that time of year. Positive values mean warmer than average, negative values colder.
Temperature anomaly 850 hPa
The departure of the temperature at the 850 hPa level (about 1.5 km) from the long-term average. It shows whether the air mass brings above- or below-average warmth, independent of surface conditions.
Wave height and direction
The estimated significant wave height at sea and the direction the waves come from. Useful for boaters, fishermen and anyone planning activities at sea. (Available in the ECMWF-IFS and EWAM models.)
Wave period and direction
The time interval between two successive waves and their direction of travel. A longer period usually means long, more powerful waves (swell), while a shorter period points to short, choppy wind waves. (Available in the ECMWF-IFS and EWAM models.)
The data shown is for informational purposes. The weather maps are the result of a computer simulation without human control and may deviate from the actual weather, especially for more distant terms and local phenomena.